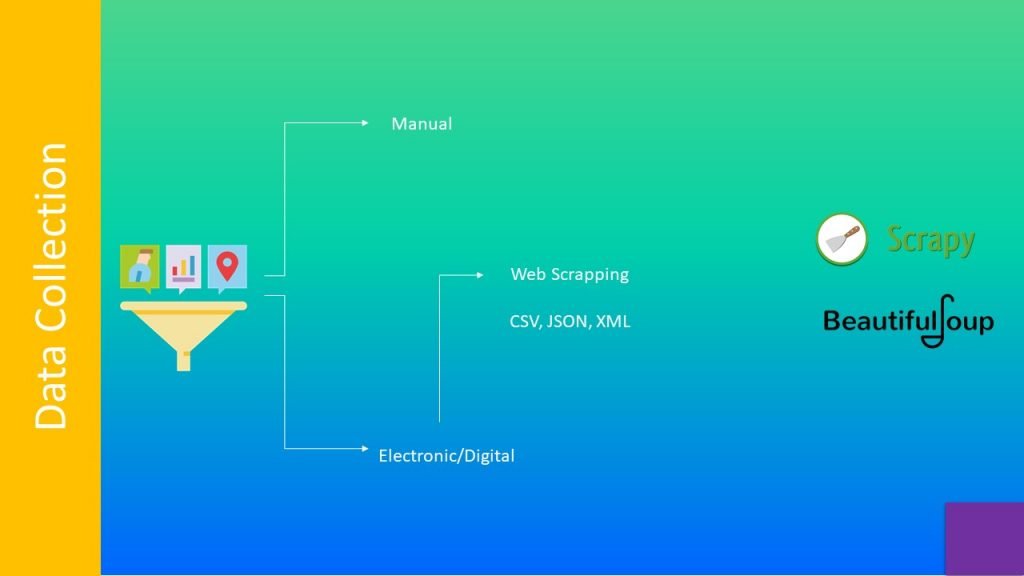
Data collection can be manual or electronic. Web scrapping is the electronic or digital way to collect data from websites in structured formats like CSV, JSON or XML. Some python libraries for data collection are Scrapy and Beautifulsoup. These python modules can fetch data from HTML pages, APIs and other sources.
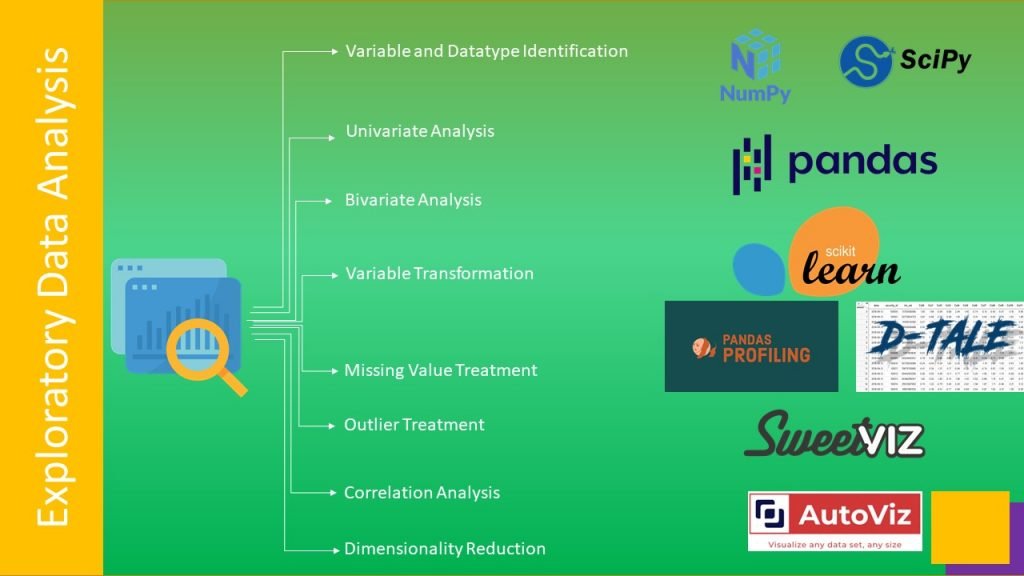
Exploratory Data Analysis unveils properties of data, It is used for Variable and Datatype Identification using dtype method provided by pandas library, Histogram , barplots, count plots, probability density functions, count of unique values, null values, and filtering based on logical ‘and’ ‘or’ conditions. are covered under Univariate Analysis, whereas Violin Plot, Box Plots, Scatter Plots are included under Bivariate Analysis, Min-Max, Standard Scalar, Log Transform , Normalization are used for variable transformation. Missing values treatment include removing the rows and columns having such data, or we can fill those spaces with mean/median /mode imputations. Outliers are such data points which are far away from rest of the data. These data points can drastically change the results of data analysis and statistical modelling, hence they can be treated with imputations, transforming and binning methods. Next is Correlation analysis. Pearson correlation is mostly used to measure the mutual relationship between two variables. Principal component analysis, Linear Discriminant Analysis are used to reduce number of input variables in large datasets. Most used Python libraries
For this task are:
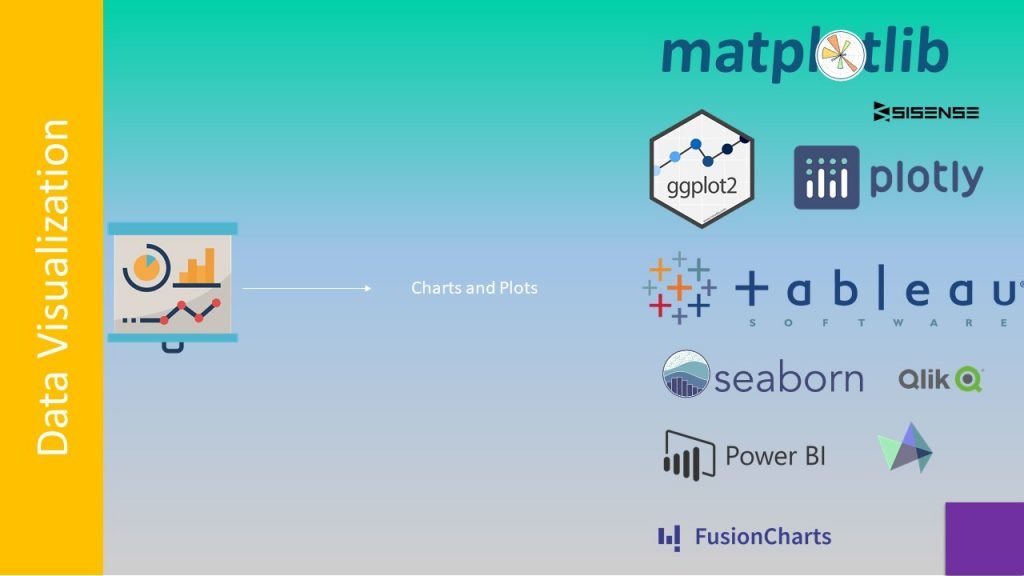
Data Visualization step uses graphical ways to understand data variations as charts and plots, . These plots are useful in interpreting data in a more noticeable manner and help in finding outliers. They are also useful for feature Engineering, Cause effect relationships and many more. Bar plots , histograms, grouped bar plots, stacked bar pots, scatter plots, violin plots, pie charts, box plots, strip plot, swarm plot, tree map, heat map, waterfall plots, Gantt charts are few examples of plots and charts.
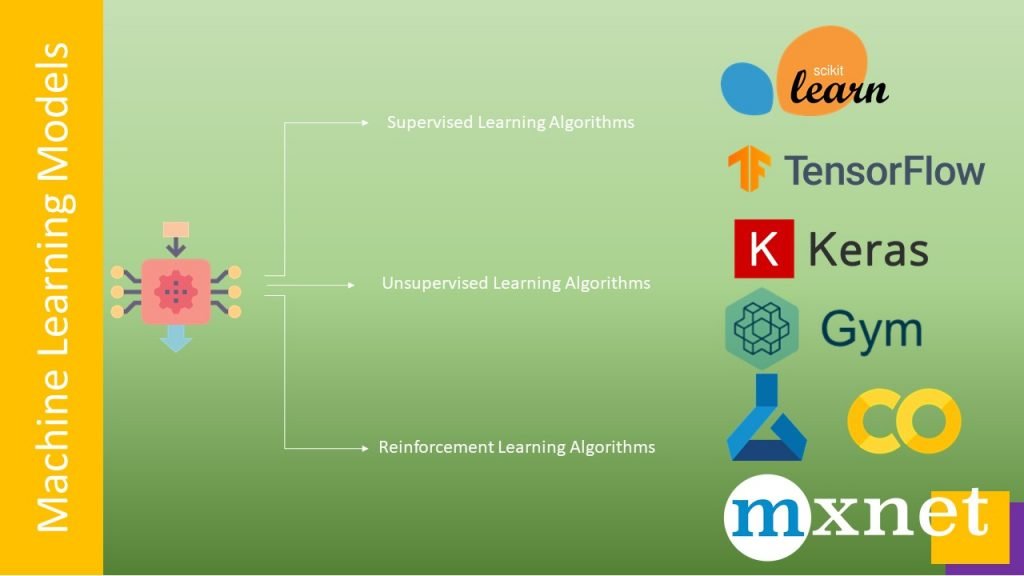
Machine learning models are such software programs which learns from historical data, then they can be used for inferring unknown values. Machine learning models implemented by algorithms using: 1.Supervised Learning Algorithms 2. Unsupervised Learning Algorithms 3. Reinforcement Learning Algorithms. Some ml algorithms used for machine learning modelling are decision trees, svm, random forest, Naïve Bayes classifiers, Linear Regression, Logistic Regression, K-Means, Dimensionality Reduction Algorithms such as pca, lda, Gradient Boosting algorithms as GBM, XGBoost, DBSCAN Clustering. Reinforcement learning has its implementations in robotics and drones, where it is used for autonomous navigation, assembling cars, finding cracks and anomalies by utilizing Deep Reinforcement learning algorithms provided by openai gym. some pretrained NN Models are VGG-16, ResNet50, Inceptionv3, Yolo, Zoo etc, are used for effiecient model building. Python libraries for easy implementation of Machine learning models are:
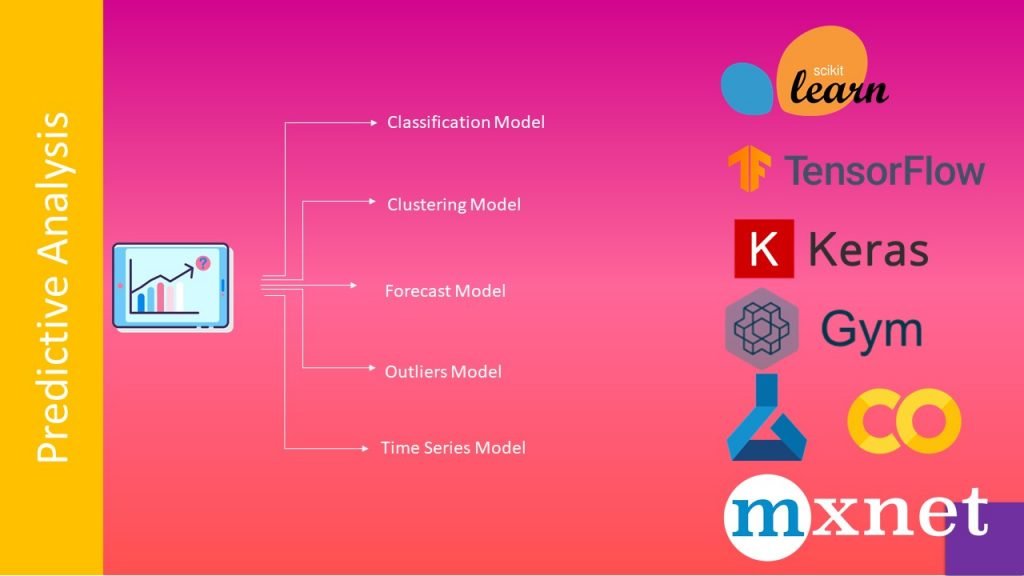
Predictive analysis can be done in 5 ways: 1. Classification model 2. Clustering model 3. Forecast model 4. Outliers model 5. Time series model. Classification models are used for binary answers that means yes or no, for example is a mail spam or not? Next is Clustering model which finds patterns in the data and associate unseen data with one of the matching patterns, one of the examples of clustering model is: will the customer buy decorative items with furniture. Forecast model deals with metric value prediction for example how many customers will buy hp laptop next month? The outliers model is oriented around anomalous data entries within a dataset for example finding anomalous data in transactions to identify frauds. Timeseries model works on sequence data by using time as the input parameter for example rainfall in coming week.
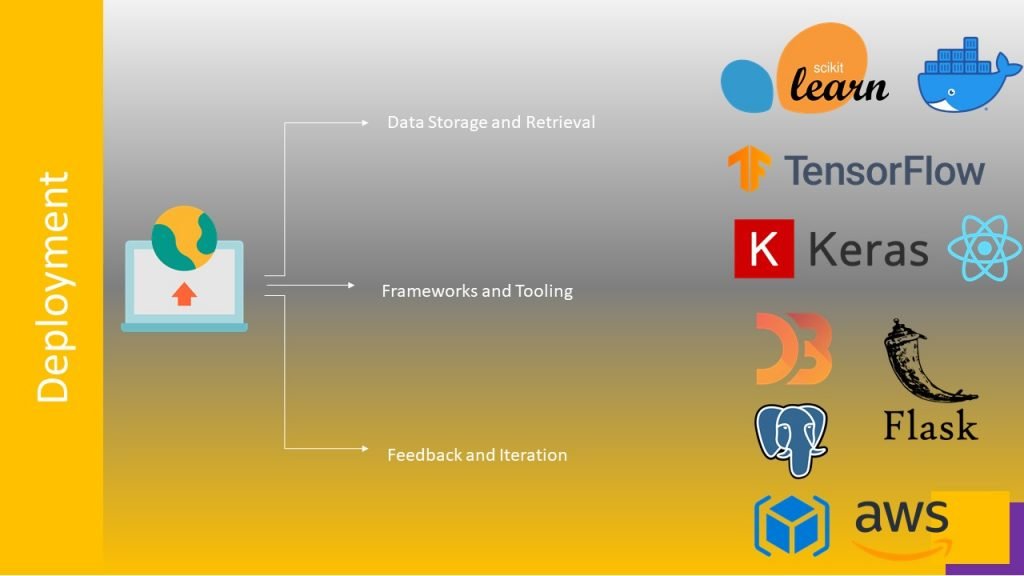
ML models need data for training purpose, if the dataset is large enough then data retrieval and processing is a tedious task, hence we need advance techniques to handle such datasets. A trained model could have thousands of parameters, if we need trained model later for transfer learning or predictions, there should be some way to save the model. Data and models can be stored on premises or on cloud. Some cloud storage are GCS, AWS S3, or Azure cloud storage.
The model wont get trained, run, and deployed by itself. For that, we need frameworks and tooling, software and hardware that help us effectively deploy ML models. These frameworks are Tensorflow, Pytorch, and Scikit-Learn for training models, programming languages like Python, Java, and Go, and even cloud environments like AWS, GCP, and Azure. Even sometimes we need combination of frameworks and tools such as combination of React and flask are used for query and retrieval.
ML projects are never static. Where we should answer questions like:
How do we get feedback from a model in production?
How do we set up continuous delivery?
Getting feedback from a model in production is very important. Actively tracking and monitoring model state can warn us in cases of model performance depreciation/decay, bias creep, or even data skew and drift. This will ensure that such problems are quickly addressed before the end-user notices.
