General Questions
Question: 1 Tell me about yourself.?
Answer:
Customise answer as per your personlity, schooling, experience, hobbies, likes , dislikes, strength, weakness, acievements , USPs…..keep talking about yourself.
Question: 2 What relevant work experience do you have?
Answer:
Customize answer about your work ex including, projects, courses, and hands-on.
Subject Specific Questions
Question: 1 What is a Normal distribution?
Answer:
A distribution is a function that shows the possible values for a variable and how often they occur. To answer this question, you are likely to need to first define what a distribution is.
So, in statistics, when we use the term distribution, we usually mean a probability distribution.
Here’s one definition of the term: A Normal distribution, also known as Gaussian distribution, or The Bell Curve, is probably the most common distribution. There are several important reasons:
- It approximates a wide variety of random variables
- Distributions of sample means with large enough sample sizes could be approximated to Normal, following the Central Limit Theorem.
- All computable statistics are elegant (they really are!!!)
- Decisions based on Normal distribution insights have a good track record.
What is very important is that the Normal distribution is symmetrical around its mean, with a concentration of observations around the mean. Moreover, its mean, median and mode are the same. Finally, you should get an extra point if you mention that 95% of the data points from a Normal distribution are located within 2 standard deviations from the mean, and 99.7% of the data points are located within 3 standard deviations from the mean.
Question: 2 How are missing values and impossible values represented in R?
Answer:
One of the main issues, when working with real data is handling missing values. These are represented by NA in R. Impossible values (division by 0, for example) are represented by NAN (not a number).
Question: 3 What is an example of a dataset with a non-Gaussian distribution?
Answer:
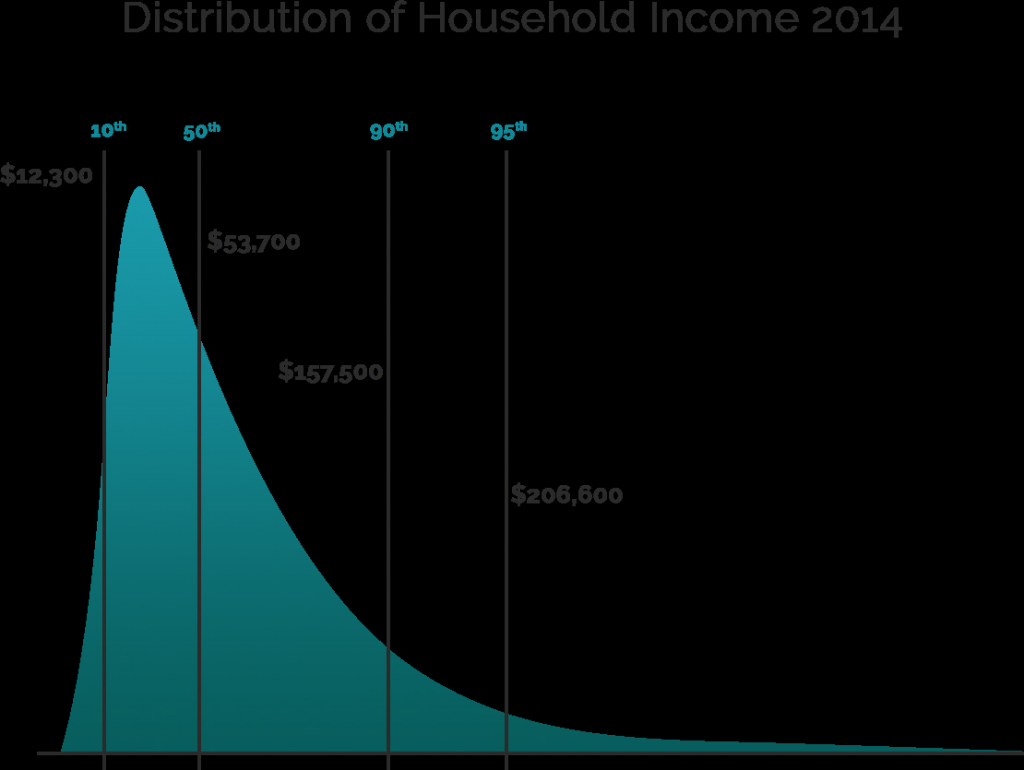
First, it may make sense to research what is a Gaussian distribution. In fact, it is also known as ‘Normal distribution’ or ‘The Bell Curve’. For further information, please refer to the question ‘What’s Normal Distribution?’ Once you are sure that you know what a Gaussian distribution is, we can proceed to the question at hand. We established that for a distribution to be non-Gaussian, it shouldn’t follow the normal distribution. One of the main characteristics of the normal distribution is that it is symmetric around the mean, the median and the mode, which all fall on one point. Therefore, all we have to do is to select a distribution, which is not symmetrical, and we will have our counterexample. One of the popular non-Gaussian instances is the distribution of the household income in the USA . You can see where the 50th percent line is, but that is not where the mean is. While the graph is from 2014, this pattern of inequality still persists and even deepens in the United States. As such, household income in the US is one of the most commonly quoted non-Gaussian distributions in the world.
Author: Iliya Valchanov
Question: 4 R has several packages for solving a particular problem. How do you decide which one is best to use?
Answer:
R has extensive documentation online. There is usually a comprehensive guide for the use of popular packages in R, including the analysis of concrete data sets. These can be useful to find out which approach is best suited to solve the problem at hand.
Just like with any other script language, it is the responsibility of the data scientist to choose the best approach to solve the problem at hand. The choice usually depends on the problem itself or the specific nature of the data (i.e., size of the data set, the type of values and so on).
Something to consider is the tradeoff between how much work the package is saving you, and how much of the functionality you are sacrificing.
It bears also mentioning that because packages come with limitations, as well as benefits, if you are working in a team and sharing your code, it might be wise to assimilate to a shared package culture.
Question: 5 What are interpolation and extrapolation?
Answer:
Sometimes you could be asked a question that contains mathematical terms. This shows you the importance of knowing mathematics when getting into data science. Now, interpolation and extrapolation are two very similar concepts. They both refer to predicting or determining new values based on some sample information.
There is one subtle difference, though.
Say the range of values we’ve got is in the interval (a, b). If the values we are predicting are inside the interval (a, b), we are talking about interpolation (inter = between). If the values we are predicting are outside the interval (a, b), we are talking about extrapolation (extra = outside).
Here’s one example.
Imagine you’ve got the number sequence: 2, 4, _, 8, 10, 12. What is the number in the blank spot? It is obviously 6. By solving this problem, you interpolated the value. Now, with this knowledge, you know the sequence is 2, 4, 6, 8, 10, 12. What is the next value in line? 14, right? Well, we have extrapolated the next number in the sequence.
Finally, we must connect this question with data science a bit more. If they ask you this question, they are probably looking for you to elaborate on that.Whenever we are doing predictive modeling you will be trying to predict values – that’s no surprise. Interpolated values are generally considered reliable, while extrapolated ones – less reliable or sometimes invalid. For instance, in the sequence from above: 2, 4, 6, 8, 10, 12, you may want to extrapolate a number before 2. Normally, you’d go for ‘0’. However, the natural domain of your problem may be positive numbers. In that case, 0 would be an inadmissible answer.
In fact, often we are faced with issues where extrapolation may not be permitted because the pattern doesn’t hold outside the observed range, or the domain of the event is … the observed domain. It is extremely rare to find cases where interpolation is problematic. Please bear in mind that last bit and don’t forget to mention it in the interview!
Question: 6 What is the difference between population and sample in data?
Answer:
A population is the collection of all items of interest to our study and is usually denoted with an uppercase N. The numbers we’ve obtained when using a population are called parameters.
A sample is a subset of the population and is denoted with a lowercase n, and the numbers we’ve obtained when working with a sample are called statistics. That’s more or less what you are expected to say.
Further, you can spend some time exploring the peculiarities of observing a population. Conversely, it is likely that you’ll be asked to dig deeper into why in statistics we work with samples and what types of samples are there.
In general, samples are much more efficient and much less expensive to work with. With the proper statistical tests, 30 sample observations may be enough for you to take a data-driven decision.
Finally, samples have two properties: randomness and representativeness. A sample can be one of those, both, or neither. To conduct statistical tests, which results you can use later on, your sample needs to be both random and representative.
Consider this simplified situation.
Say you work in a firm with 4 departments: IT, Marketing, HR, and Sales. There are 1000 people in each department, so a total of 4000 people. You want to evaluate the general attitude towards a decision to move to a new office, which is much better on the inside but is located on the other side of the city.
You decide you don’t really want to ask 4000 people, but 100 is a nice sample. Now, we know that the 4 groups are exactly equal. So, we expect that in those 100 people, we would have 25 from each department.
1) We pick 100 people (out of the 4000) at random and realize that we have 30 IT, 30 Marketing, 30 HR, and 10 from Sales. Obviously, the opinion of the Sales department is underrepresented. We have a sample, which is random but not representative.
2) I’ve been working in this firm for quite a while now, so I have many friends all over it. I decide to ask the opinion of my friends from each department because I want them to feel comfortable in the workplace. I pick 25 people from each department. The sample is representative but is not random.
In the first case, we have underrepresented some group of people. In the second case, we’ve made a decision based on a specific circle of people and not the general ‘public’.
If I want it to be random and representative, I will pick 25 people from IT at random, then 25 people from Marketing at random, same for HR and Sales. In this way, all groups will be represented, and the sample will be random.
You can decide to skip that detailed explanation, or better – ask them if they want you to dive deeper into the topic and then impress them with your detailed understanding!
Question: 7 What are the steps in making a decision tree?
Answer:
First, a decision tree is a flow-chart diagram. It is extremely easy to read, understand and apply to many different problems. There are 4 steps that are important when building a decision tree.
1) Start the tree. In other words, find the starting state – maybe a question or idea, depending on your context.
2) Add branches. Once you have a question or an idea, it branches out into 1,2, or many different branches.
3) Add the leaves. Each branch ends with a leaf.The leaf is the state which you will reach once you have followed a branch.
4) Repeat 2 and 3. We then repeat steps 2 and 3, where the starting points are the leaves, until we finish-off the tree. In other words, every question and possible outcome should be included.
Depending on the context you may be expected to add additional steps like: complete the tree, terminate a branch, verify with your team, code it, deploy it, etc.
However, these 4 steps are the main ones in creating a decision tree. Whether to include these extra steps really depends on the position you are applying for.
If you are applying for some data science project management position, you may be expected to say: ‘Validate with all stakeholders to ensure the quality of the decision tree’.
If you are applying for a data scientist position, you may be expected to explain a bit more about the programming language and library you intend to use. This also includes the reason why you’d choose that library.
Question: 8 How is machine learning deployed in real-world scenarios?
Answer:
This question is a bit tricky. Model deployment is a part of a data science job, but in fact, efficient model deployment is more often related to engineering, software development, cloud computing, etc. In other words, to make sure everything is right, you’d better turn to your IT department or hire a computer scientist in your team.
Now, there are 3 important steps:
1) Once you train a model, you should save it, or better – store it in a file. There are different ways in which this could be achieved. The general ‘Pythonic’ ways are through pickle or joblib. However, libraries such as TensorFlow deal with much more complicated model objects and thus they offer ad-hoc functions for deployment. Often they look like this: .save(‘filename’).
This part of the process is always done by the data scientist, ML engineer, or whoever is in charge of the model training.
2) Computing instance. AWS and Microsoft Azure offer computing instances or cloud-based environments that can run the model you’ve just created. Surely, you can share the file with your colleagues through email or Messenger, but more often, there will be some cloud that handles the deployment.
The computing instance should be set-up to communicate with all other systems that feed the inputs and/or require the outputs of the model.
3) Job scheduler. Having a model and a place to run it, you can specify when and how to run it. That could be once a week, once per day, or every time an event occurs (e.g. a transaction, new user registration, etc.). At the desired time, new data would be taken, loaded, cleaned, preprocessed, fed to the model, etc. until you reach the desired outcome.
Having completed these 3 steps, you are practically done.
You will have a model, running on some cloud at prescheduled times. Once you’ve got an output, you can return it to a Python notebook, or better connect it to yet another system (that could be considered a part of 2.). Depending on your needs, it could be a web app (e.g. a recommender system gives information about a particular customer and shows them relevant results), or some kind of visualization software such as Tableau or PowerBI which would analyze your data in real time.
Needless to stress, 2. and 3. would rarely be a data scientist’s primary job. Still, in a smaller team, that may fall on them, too!
Question: 9 What is K-means clustering? How can you select K for K-means?
Answer:
The main goal of clustering is to group individual observations so that the observations from one group are very similar to each other. In addition, we’d like them to be very different from the observations in other groups. There are two main types of clustering: flat and hierarchical. Hierarchical clustering is much more spectacular because of the dendrograms we can create, but flat clustering techniques are much more computationally efficient. Therefore, we usually opt for the latter.

Author: Iliya Valchanov
K-means clustering is the most prominent example of flat clustering.
It consists of finding K clusters, given their mean distance from the centers of the clusters. K stands for the number of clusters we are trying to identify. This is a value, selected prior to the clustering.
Now, the optimal number of clusters is obviously what we are usually interested in.
There are several ways to approach that, but the most common one is called: ‘The Elbow Method’.
There, we solve the clustering problem with 1, 2, 3, 4, 5, 6 and so on number of clusters. We then plot them on a graph where on the x-axis we’ve got the number of clusters, while on the y-axis, the WCSS (within cluster sum of squares). The resulting image resembles a human elbow. The place where the kink is signifies the optimal clustering solution. And that’s how you choose the ‘K’ in K-means!
Question: 10 What are the disadvantages of a linear model?
Answer:
This is one of the strangest questions you could be asked. It is like being asked: ‘what are the disadvantages of playing tennis barefoot?’ You don’t need shoes to play tennis, but it is much better if you do.
Now, the most common linear models are the linear regression model and linear time series model. Therefore, let’s answer the question in that context.
The single biggest advantage of a linear model is that it is simple. From there, there are mainly disadvantages and limitations.
Therefore, let’s focus on the top 3 cons of using a linear model.
1) Linear model implies linear relationships.
A linear model assumes that the independent variables explain the dependent one(s) in a linear way, e.g. a = bx + c. No powers, exponents, logarithms, etc. are allowed.
Obviously, this is a great simplification – the real world is not linear. Using a linear model, would either disregard some patterns or force us to execute complicated transformations to reach a linear representation.
2) Data must be independent.
In the general case, that’s not always true, but in 95+% of the linear models conducted in practice – it is. Most linear models assume that the variables in the model are not collinear. Alternatively, we observe multicollinearity or the math behind the model estimation ‘brakes’. Assuming that the variables are independent is obviously a very brave statement especially because we are limited to a linear relationship (if we had exponents and logarithms, the probability that they are collinear would drop dramatically).
3) Outliers are a big, big issue.
Since linear models assume linearity, having values that are too big, or too small regarding any feature may be devastating for the model. All points are expected to be close to some line, which as you can imagine is rather unrealistic. To deal with that we often complicate the linear model in ways that practically make it behave like a non-linear one.
Question: 11 Describe a time when you were under pressure.
Answer:
Do you know the saying “When the going gets tough, the tough get going?”
Every Hiring Manager wants to make sure you can handle the pressure of the job. Are you someone who is likely to abandon the boat when things get a little tough? Every firm needs people that are reliable. All jobs involve a certain element of pressure; some more than others, obviously. Your task here is to give an example of a stressful situation and show how you coped with it.
Here’s an example of such a situation:
I was under significant pressure before taking my GMAT exam. I needed a really good grade in order to be admitted to the graduate school that I am now graduating from. A few weeks before the exam, I noticed that I was becoming nervous. Two things helped me handle the pressure much better; I started sleeping for at least 7 hours (going to bed earlier in the evening) and I dedicated at least one hour a day to sports activities. This had a hugely positive impact on my concentration and stress level
Question: 12 How would you add value to our company?
Answer:
Did you see “The Wolf of Wall Street”? Remember Jordan Belfort’s famous quote “sell me this pen”? The same principle applies to this question as well, although instead of selling a pen, you need to sell the idea of you landing the job. This is what the recruiter is asking you to do. You need to convince him/her that you will add value to the company. But, how are you going to be able to tell how you would add value to the company before having worked for the company?
Most candidates will start by listing their qualifications, work experience, personal traits, achievements, and they will be hoping to push the right button, somewhere along the way.
Similarly, when facing the “sell me this pen” task, most people start describing the pen’s attributes; it is a great pen, writes very well, it is very shiny and smooth, etc.
It is natural to focus on your qualities and qualifications when asked how are you going to add value to the company.
However, this is a trap.
Most people would do just that. They will explain that they are great and that they are qualified. But that fails to answer the question itself, right? How are you going to add value? Analogically, the person who is being sold a pen can ask “Why do I need this pen?” Instead of falling for this trap and responding like everybody else, you can instead show that you are different by using an alternative approach.
Turn this into a back and forth dialogue and figure out what value needs to be added to the team that you will be joining.
What does the company need? Are there any supplementary skills that are missing? Is there a particular area that they would like to reinforce? Learn more about the Interviewer’s take on the current situation and understand precisely what is expected from you. Don’t be shy to ask about the company’s mid-term strategy and the type of people that they will need in the future. Then you can nail the question by pointing out how your qualifications and motivation match with the needs that they have.
The whole dynamic of this type of question is driven by the fact that before you are able to sell a pen, you have to know more about the person who is going to buy it, what are his needs and what kind of pens is he usually writing with. Once you have positively identified a need, you can point out that your product is the right solution for that need.
Question: 13 How do you explain Random Forrest to a non-technical person?
Answer:
Random Forest is a classification algorithm. Its main purpose is to match a specific observation with its observed outcome. An important defining characteristic of a random forest is that it is simply a collection of decision trees.
There are many terms involved, but in fact, the concept is rather simple and could be easily illustrated with an example.
Let’s say you want to create a meeting. A decision tree for that meeting may be:
Monday
- No
- Yes
1PM to 2PM
- No
- Yes
Room 160
- No
- Yes
3PM to 4PM
- No
- Yes
Room 155
- No
- Yes
Based on this tree, we would normally estimate probabilities to have the meeting in one place or another.
The main issue is that this is a very bad classifier. However, combining many such trees we reach a random forest. The underlying assumption is that many bad classifiers equal a good classifier. Each tree makes a prediction (which observation to put in what class) and then the class with the most “votes” across all trees will be our random forest prediction.
Question: 14 What’s wrong with training and testing a machine learning model on the same data?
Answer:
This is one of the more common questions. When we are training a model, we are exposing it to the ‘training data’. This means it is learning the patterns from it. By the end of the training, it becomes very good at predicting this particular dataset. However, sometimes we may overfit. This is a situation where we keep improving the accuracy, but not because the model is good, but just because it has learned every little detail about the data it is given.
If we test on that data, we will be checking the accuracy of the training. This is not a test per se. That’s simply a ‘train accuracy check’. Our model will seem to be very accurate and working properly, but that is because we trained it on that same data. We are essentially asking the model to predict what was already predicted, which is not a hard task.
To truly test a model, we must expose it to data it has never seen before. This will reveal if it learned the patterns of the population, or simply the noise in the training data.
Question: 15 How to make sure you are not overfitting while training a model?
Answer:
First, we need to clarify what overfitting is exactly. Usually, overfitting happens when your model fits the training data so well that it misses the point. In other words – it doesn’t look for the general patterns, but for the noise in the data provided. If that happens, when provided with new data, the model behaves disastrously in a real-life setting.
Regularization – In the context of machine learning refers to the process of modifying a learning algorithm so as to make it simpler often to prevent overfitting or to solve a badly posed problem.
- Early stopping – early stopping is the most common type of regularization. It is designed precisely to prevent overfitting. It consists of techniques that interrupt the training process, once the model starts overfitting.
- Here you may be expected to say ‘validation’ or ‘cross-validation’. In fact, early stopping methods always use the outputs from the validation to determine whether to stop the training process.
- Feature selection – for some models, having useless input features leads to much worse performance. Therefore, you have to make sure to choose only the most relevant features for your problem otherwise this may affect (among other things) overfitting.
- Ensembling. Ensembles are methods to combine several base models in order to produce one optimal predictive model. A good example of the ensemble method is Random Forest (a collection of decision trees).
It is very important to realize that overfitting is an extremely important issue. Every model will overfit if no preventative techniques have been implemented. Therefore, you should always aim to apply one or more of these techniques in your model building efforts.
Question: 16 What is cross-validation? How to do it right?
Answer:
Cross-validation refers to many model validation techniques that use the same dataset for both training and validation. Usually, it is on a rotational basis so that observations are not overexposed to the training process and thus can serve as better validation. It is mainly used in settings where the goal is prediction, and one wants to estimate how accurately a predictive model will perform in practice.
Why do we even need to validate?
Well, when you use sample data (so most of the time), you need to make sure that your model is not overfitting the parameters.
So how do we validate? We take out like 10% of the data for later use and train on the remaining 90%. Once we are done, we validate on the 10% we set aside at the beginning. This is a pretty common practice but has one major drawback – some of the data (these 10% precisely) is not really utilized in the training process.
That is where cross-validation comes in.
Cross-validation does the same thing as simple validation, but it first divides the dataset into equal parts (5,10,20 depending on the size of data). To cross-validate, it sets aside the first part and trains on the remaining parts. Then it sets aside the 2nd part and trains on the remaining ones (this time, including the first part). We continue in that way, utilizing a different subset for each validation. In that way, the model gets exposed to all the data in contrast to conventional validation.
Question: 17 How do you create a table in R without using external files?
Answer:
This is practical knowledge that can be tested with a coding task, but it’s possible you are asked this question as a stand-alone. In that case, you can ask about the use case for the numbers you’re generating.
First, if you need a data table for the sake of having data to test on, you can just use one of R’s preloaded datasets. You can access the list by calling data().
If you’d like to still create a table from scratch, you can use any of the random generator functions in R to generate random numbers according to a distribution, and store them in a matrix or a data frame. The functions are:
- runif()
- rnorm()
- rbinom()
- rexp()
You can also use sampling with or without replacement to generate your data and populate a table.
If you need an empty table to be filled out later, you can initiate empty vectors and create your data frame.
Finally, you could use an interactive method, for a quick solution to a small-scale problem. Creating an empty data frame and editing it with edit(df) will toggle an interactive spreadsheet view you can manually populate.
Question: 18 Explain the significance of Transpose in R.
Answer:
Transpose is one of the simplest ways you can reshape a data structure in R. If you transpose a data frame or a matrix, you will essentially be rotating the data, so rows become columns, and vice versa. In terms of use cases, transposing is sometimes needed to tidy data for analysis. If the raw format has observations recorded as columns, transposing the
data structure would ensure the data is keeping to the convention whereby observations are organized in rows and variables are represented by columns. Transposing is also necessary for matrix multiplication used vastly in machine learning, deep learning, etc. The t() function is the default way to transpose in R. If this simple function fits your needs, you don’t need anything else. If the data you’re trying to reshape is messier, {dplyr} and {tidyr} can provide a good set of functions to deal with it – grouping, mutating, pivoting…
Question: 19 Why would you use a Null as a data value?
Answer:
To answer this question, it’s important not to confuse a NULL value with the value of 0 or with a “NONE” response. Instead, think of a null value as a missing value. 0 or “NONE” could be values assigned by the user, while “NULL” is a value assigned by the computer if the user has provided no value for a given record.
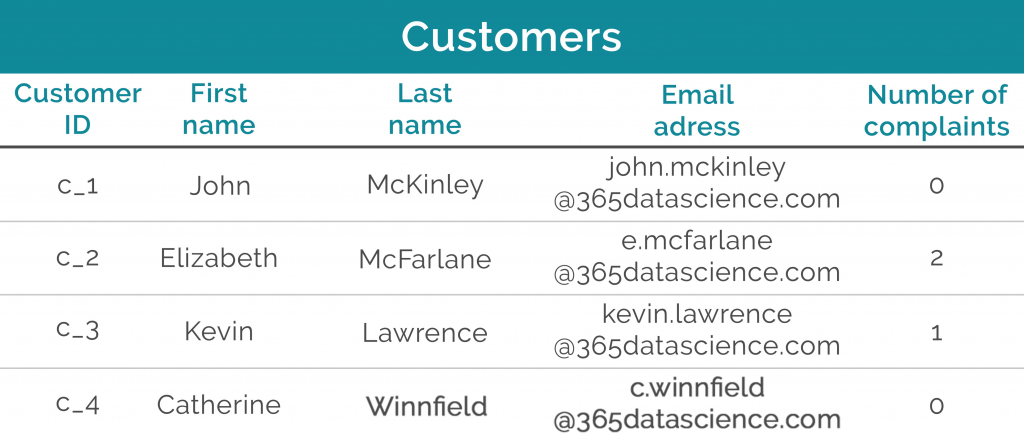
Consider the Customers table below.
If you know John McKinley has filed 0 complaints, then in the “number of complaints” column in the “Customers” table, you could insert 0. This doesn’t mean the value is null – not at all! You have a value of zero, and the information in this field for this first record is not null. It means John has filed no complaints.
If we have no information regarding the number of complaints John has filed, then the value would have been null.
By the same logic, imagine there was an additional column, called “Feedback”, and that it is optional. If the first three customers have provided some feedback, while Catherine has said she didn’t want to leave any, does that mean this value is null? No, because Catherine didn’t want to provide any feedback, so we could mark her response as “NONE”.
If she hasn’t replied yet, only then our value would have been null.
Author: Iliya Valchanov
Question: 20 What is a primary key and a foreign key?
Answer:
A primary key is a column (or a set of columns) whose value exists and is unique for every record in a table. It’s important to know that each table can have one and only one primary key.
Therefore, you can think of a primary key as the field (or group of fields) that identifies the content of a table in a unique way. For this reason, the primary keys are also called the unique identifiers of a table.
Another crucial feature of primary keys is they cannot contain null values. This means, in an example with a single-column primary key, there must always be a value inserted in the rows under this column. You cannot leave it blank.
One last remark about primary keys – not all tables you work with will have a primary key, although almost all tables in any database will have a single-column or a multi-column primary key.
A foreign key, instead, is a column (or a set of columns) that references a column (most often the primary key) of another table. Foreign keys can be called identifiers, too, but they identify the relationships between tables, not the tables themselves.
In the relational schemas form of representation, relations between tables are expressed in the following way – the column name that designates the logical match is a foreign key in one table, and it is connected with a corresponding column from another table. Often, the relationship goes from a foreign key to a primary key, but in more advanced circumstances, this will not be the case. To catch the relations on which a database is built, we should always look for the foreign keys, as they show us where the relations are.
Question: 21 Describe a parent-child relationship in the context of a relational database.
Answer:
Remember the function of a foreign key (see above)? It points to a column of another table and, thus, links the two tables. It is a field or collection of fields from one table, called the child table, and it refers to a column in another table, called the parent table. Usually, the column or the set of columns in the parent table is the primary key of that table. (The child table can also be called the referencing table, and the parent table can be called the referenced table.)
Question: 22 Given a table with duplicate data, how would you extract only specific rows based on business requirements provided?
Answer:
In most cases, the tools form the Data Manipulation Language (DML) will allow you to do that. Usually, you could either use a SELECT DISTINCT statement to select distinct rows only or apply a GROUP BY clause to a join to filter the data in the desired way.
Behavioral Questions
Question: 1 What motivates you about this position?
Answer:
By asking this question, the recruiter wants to understand whether you are excited about the new opportunity that lies ahead of you. Your enthusiasm, of course, is highly correlated with the amount of effort you will put once the job is offered. A motivated person would try to be proactive and create a positive working environment, which is precisely
what every company needs. The real question isn’t whether you should say that you are motivated. Of course, you should. You need to think of a way that would best show that you are genuinely interested in the position under consideration. There are a lot of different things that can motivate you:
- The learning opportunities that you will have on the job
- Future growth prospects
- You like the team that you will be inserted in (if you have met them)
- You share the company’s values/mission
- The company operates in a dynamic, ever-changing industry
- The company’s prestige
Of course, remuneration is one of the main motivators for almost all people. However, talking about money is not a good idea at this point in the selection process. Instead, focus on some of the aspects that we listed above and customize them to the specific position that you are applying for.
What you say while answering this question is not the only important thing. Your interviewer will be eager to see that all signs point in the same direction. Try to show that you are excited through your voice, posture and body language. This can be the critical difference that will determine whether or not you will be selected.
Question: 2 Give me an example of a time when you had to go the extra mile?
Answer:
Going the extra-mile is rarely a one-time act. More often, it is an ingrained habit. You need to properly explain to your recruiter that you love the idea of working that job. Also, explain how you want to be excellent at it. Your internal drive towards excellence is what motivates you to go the extra mile – to do the things that you are not expected to do:
- Study during the weekends
- Stay late in the office
- Striving for excellence constantly
If the job you are interviewing for is what you chose for your life, then you want to be excellent at it. Striving to achieve excellent performance is important. It means that you want to put quality in your work and create value for the company. Internal drive is probably the best reason to go the extra mile; you are willing to do what is necessary in order to be good at what you do.
An example of such a situation:
During your previous internship experience, you put in a lot of extra effort in order to show that your tutor who also recruited you did not make a mistake. You stayed late and studied during the weekend because you wanted to improve your skills and to do it faster. The positive impression that you left with your work led to an excellent valuation and very positive feedback about your willingness to learn.
Question: 3 Can you tell me a time when you were able to build motivation in your co-workers?
Answer:
This question aims to assess whether you are a good leader and a positive influence at your workplace. Hiring managers look for people who are motivated themselves and are able to transmit their drive to their co-workers. Strong motivation makes for excellent results.
In order to be able to motivate someone, you have to fully understand the person that you are approaching. What is it that they currently need in order to be excited about a project? Perhaps they need:
- One-on-one coaching
- Interesting tasks
- More complicated tasks
- Responsibility
- Autonomy
- Recognition
- A positive perspective
An example of such a situation:
During your previous internship within the Corporate Finance department of a large firm, you were asked to prepare a Valuation model. There was another intern who was assigned to work with you. Given that she had less experience with Financial Modeling, she could only help you with minor data entry and consistency checks. You noticed that this was not particularly stimulating for her, as this is something she already knew how to do and she really wanted to learn how to create the model itself. You realized that she would be more motivated to do her part if she was given the opportunity to learn as well. That is why you asked her whether she would like to sit next to you while you work on the model, so that the two of you can comment on what you are doing together. This greatly motivated her and she came up with some valuable suggestions when you had to prepare a presentation that summarizes the model that you prepared.
Question: 4 How do you handle a challenge?
Answer:
First of all, you want to give the impression that you are someone who welcomes a challenge. You are a person who is willing to leave his/her comfort zone and embrace challenging situations. You learn the most when you are put in a difficult situation. And this is certainly something that the Hiring Manager is looking to hear from you. The second part of the question is how you actually handle a challenge. Do you have a structured approach? Are you a person who builds a plan of action and then sticks to it? It would be best if you could provide an example of your past experience. A story showing that:
- you understood the issue
- you created a plan of action
- you executed the plan of action successfully
An example of such a situation:
Let’s say that you were admitted to a Master’s in Economics. A really challenging situation arose because you knew that most of the people in the class had already studied Finance and Econometrics, while you concentrated on Leadership courses. There was a significant gap between your skills and those of others. You realized that. You also realized that the only way to address the issue was to start with the very basics and fill the knowledge gap step by step; a very long process that required significant efforts on your end. An encouraging sign was that the results at the end of the first semester showed that you reduced the gap significantly and were heading in the right direction. By the end of the second semester, your GPA was slightly higher than the average for the class.
Question: 5 What is your greatest weakness?
Answer:
The problem with this question is that you are being asked about your shortcomings, while you are doing an interview and you want to make a good impression. Make sure that you don’t choose something that can impede you from being great at the job you are interviewing for. For example, if you are interviewing for a controller or a financial analyst, it is OK to say that you do not like to speak in public. However, if you are applying for a consulting or an investment bank job you should not say that, because public speaking can be essential for those professions.
Choose a weakness that you can turn into a positive. “I am usually not good at…but I am making an effort to improve that”. Avoid cliché answers like “I work too hard” and “I am a perfectionist”. No one is perfect – that is why you need to indicate a weakness when you are asked about one. This shows that you are self-aware and have listened to feedback.
An example of such a situation:
The tutor at my previous internship gave me some interesting feedback: “Don’t try to do too much.” I remembered that and had a chance to reflect on it, once the internship was over. He was right; I tried to do too much. I was eager to prove myself and implement everything that I learned in university so I could perform great. Trying to implement complex models and “doing too much” is something that I need to control in the future.
This experience allowed me to understand that greatness is a lot of small things done well.
Therefore, I decided that the next time when I am facing a similar situation, I will focus on my own duties and will make sure that I do everything that is expected of me well, instead of trying to invent the next formula of relativity.
Question: 6 How do you handle working with numbers/ clients multiple tasks/stress?
Answer:
Each of these aspects can be really important for a given position and the Hiring Manager will want to make sure that you are the right person that he/she is looking for. Try to figure out the most important characteristics of the job that you are applying for. Are you expected to do multitasking? What part of your overall responsibilities would be related to financial figures? Are you going to interact with many people?
Based on your findings, you will know what to expect. Prepare good examples from your past that can serve as proof of your statements.
Question: 7 What would you do if the priorities of an important project you were working on suddenly changed?
Answer:
It’s a very broad question, isn’t it? Try answering by asking some questions that can guide you to the right answer:
- Who changed the project’s priorities? Your boss? Clients? Suppliers? External Factors?
- Why did they change priorities?
Try to understand the reason behind the decision and assess whether it is a valid one. Is there something that you can do about it?
If you believe that you can propose a solution, don’t be shy about contacting the responsible manager and sharing your idea.
If you believe that the reason for shifting priorities is not valid, raise your concerns with Management.
If there is nothing to do about the decision (external factors that can’t be changed are the reason or your Boss says that despite your concerns, the decision to change priorities remains), create a course of action and make sure that everybody on your team is aligned with the new priorities. Schedule a reasonable deadline and think of the best way that you can achieve the new goals.
Question: 8 What would you do if someone at work resisted your ideas?
Answer:
Again, open communication is the best way to approach this problem. First of all, you need to make sure that you are fully explaining your ideas. Perhaps you can try an alternative approach? You can provide practical examples or make a list of the pros and cons of your suggestion. Then you should try to understand your colleague’s point of view. What are the reasons behind his resistance? If his point is valid as well, think of an alternative approach together regarding the problem. Maybe you can create a hybrid solution that will include your ideas and will address his concerns.
Question: 9 Is there anything else that we should know about you?
Answer:
Yes. The answer to this question is always “Yes”. There are many things that they should know about you. This question typically comes at the end of the interview and it is an opportunity to close in a strong fashion. There is no need to pass up on this extra opportunity that you are given by the interviewer. Try to address some of the following points that did not come up during the interview:
- Skills that are relevant for the job under consideration
- Past experience that will help you to be successful at this job
- Motivation to work for the company in the particular role that you are interviewing for
- What is going to be your added value to the team that you will be placed in
One of the basic rules in sales is that you need to convince your client that he/she needs your product. This is a similar situation. Make a closing statement that will convince your interviewer that you are the right person that they are looking for.
Question: 10 Imagine the following situation:
You’re in a room with 3 light switches. In the next room, there are 3 light bulbs, each controlled by one of the switches. You have to find out which switch controls each bulb by checking the room just once. Keep in mind that all lights are initially off, and you can’t see into 1 room from the other. So, how can you figure out which switch is connected to which light bulb?
Answer:
And here’s the answer:
Let’s say we have switches 1, 2, and 3. What you can do is leave switch 1 off, turn switch 2 on for 5 minutes, and then turn it off. Then turn switch 3 on and leave it like that. Then you enter the room. Obviously, switch 3 controls the light bulb you left on. The bulb that is off but still warm, is controlled by switch 2. And switch one controls the light bulb you
never turned on.
Question: 11 You want to buy a work of art that was $400 but is now sold at 25% off.
How much is the promotion price?
Answer:
It’s time for a quick calculation: What’s 75% off $400? The answer is $300. Of course, if you’re into numbers and like using shortcuts, don’t hesitate to think out loud.
Question: 12 How many square feet of pizza are eaten in the United States each month?
Answer:
Let’s say there are roughly 300 million people in America, out of which 200 million eat pizza. Now, suppose the average pizza-eater has pizza twice a month and eats two slices at a time. That makes four slices per month. Let’s say the usual slice of pizza is about six inches at the base and 10 inches long. That means the slice is 30 square inches of pizza. Consequently, four slices of pizza would amount to 120 square inches. We know that one square foot equals 144 square inches, we can say that each pizza-eater consumes one square foot per month. And, as there are 200 million pizza-eaters in America, we can conclude that 200 million square feet of pizza are consumed in the US each month.
Brainteasers: Scenario Based QnA